Project Summary & Key Insights
Executive Summary
This study analyzes three credit card acquisition strategies, revealing optimal approaches for different consumer profiles. Through a Miro flowchart detailing strategic card sequences and an interactive Tableau dashboard modeling financial outcomes, we've quantified how consumers can generate significant value ($41-$173/month) through systematic card acquisition. Our findings show No Fee Flamingo offers best ROI (53%), Business Bee delivers highest returns ($3,121 over 18 months), and Chase dominates across all segments. Banks maintain profitability through merchant fees, annual fees, and interest from non-strategic customers.
Optimal Consumer Strategy
Choose a strategy matching your spending capacity and financial goals
Cancel or downgrade cards strategically to avoid unnecessary annual fees
Optimize category spending to maximize rewards value
Consider long-term sustainability rather than short-term gains
Cancel or downgrade cards strategically to avoid unnecessary annual fees
Optimize category spending to maximize rewards value
Consider long-term sustainability rather than short-term gains
Optimal Lender Strategy
Position strategically across customer segments to drive acquisition
Create product ecosystems for cross-selling opportunities
Balance generous rewards with profit mechanisms
Target appropriate consumer personas to optimize portfolio performance
Create product ecosystems for cross-selling opportunities
Balance generous rewards with profit mechanisms
Target appropriate consumer personas to optimize portfolio performance
Conclusion
Credit card churning allows consumers to extract significant value from financial institutions. Strategic consumers can generate hundreds or thousands of dollars through systematic card acquisition, but banks maintain profitability through built-in mechanisms. The optimal consumer strategy aligns with your spending habits, risk tolerance, and organizational capacity. Is this "gaming the system"? Perhaps - but banks continue offering these incentives because they work as customer acquisition tools within their broader business model.
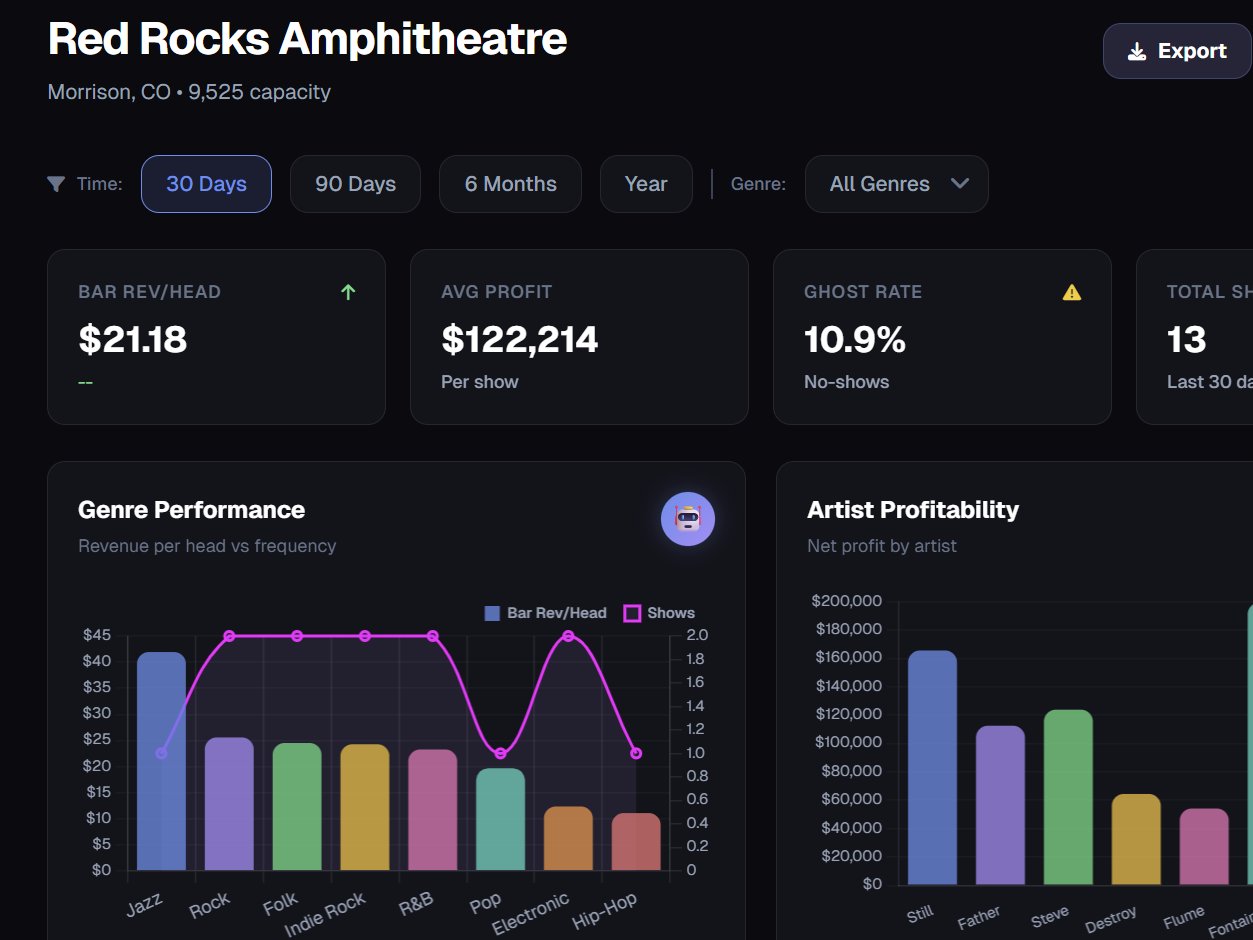
Tableau Dashboard
Consumer Persona Breakdown
Lender Positioning Breakdown
🦩 No Fee Flamingo
Strategy: No annual fees, cash back focus
Cards: Secured/Student Card → 5% Rotating Card → 2% Flat Card → Custom 5% Card
Best for: Beginners, low spenders, credit builders
Key metrics: $41/month average value, 16% value per dollar spent
🏦 JP Morgan Chase
Strategy: Full-spectrum domination, diverse ecosystem, premium benefits
Target Personas: All three (No Fee Flamingo, Traveling Toucan, Business Bee)
Key Cards: Chase Freedom Flex, Chase Sapphire Preferred, Chase Ink Business lineup
Market Position: Dominant across all segments, particularly Business Bee
🦜 Traveling Toucan
Strategy: Travel rewards, premium benefits
Cards: Premium Travel Card → Flexible Points Card → Premium Perks Card → Triple Category Card
Best for: Frequent travelers, moderate spenders
Key metrics: $82/month average value, 6.1% value per dollar spent
💳 Capitol One
Strategy: Entry-level excellence, simplicity focus
Target Personas: Primarily No Fee Flamingo, secondary Traveling Toucan
Key Cards: Capital One Savor Student, Capital One Venture X
Market Position: Leader in No Fee segment, highest ROI card (53%)
🐝 Business Bee
Strategy: Business cards with high signup bonuses
Cards: Cash Back Business Card → Flat-Rate Business Card → Flexible Points Business Card → Premium Business Travel Card
Best for: High spenders, business owners
Key metrics: $173/month average value, 10.8% value per dollar spent
🌐 American Express & Citi Bank
Strategy: Niche specialists, complementary roles with unique category strengths
Target Personas: Secondary positions across all three personas
Key Cards: Amex Blue Business Plus, Citi Custom Cash, Citi Premier
Market Position: Strategic additions to rounded portfolios, filling optimization gaps
Credit Card Churn Flowchart (Miro)
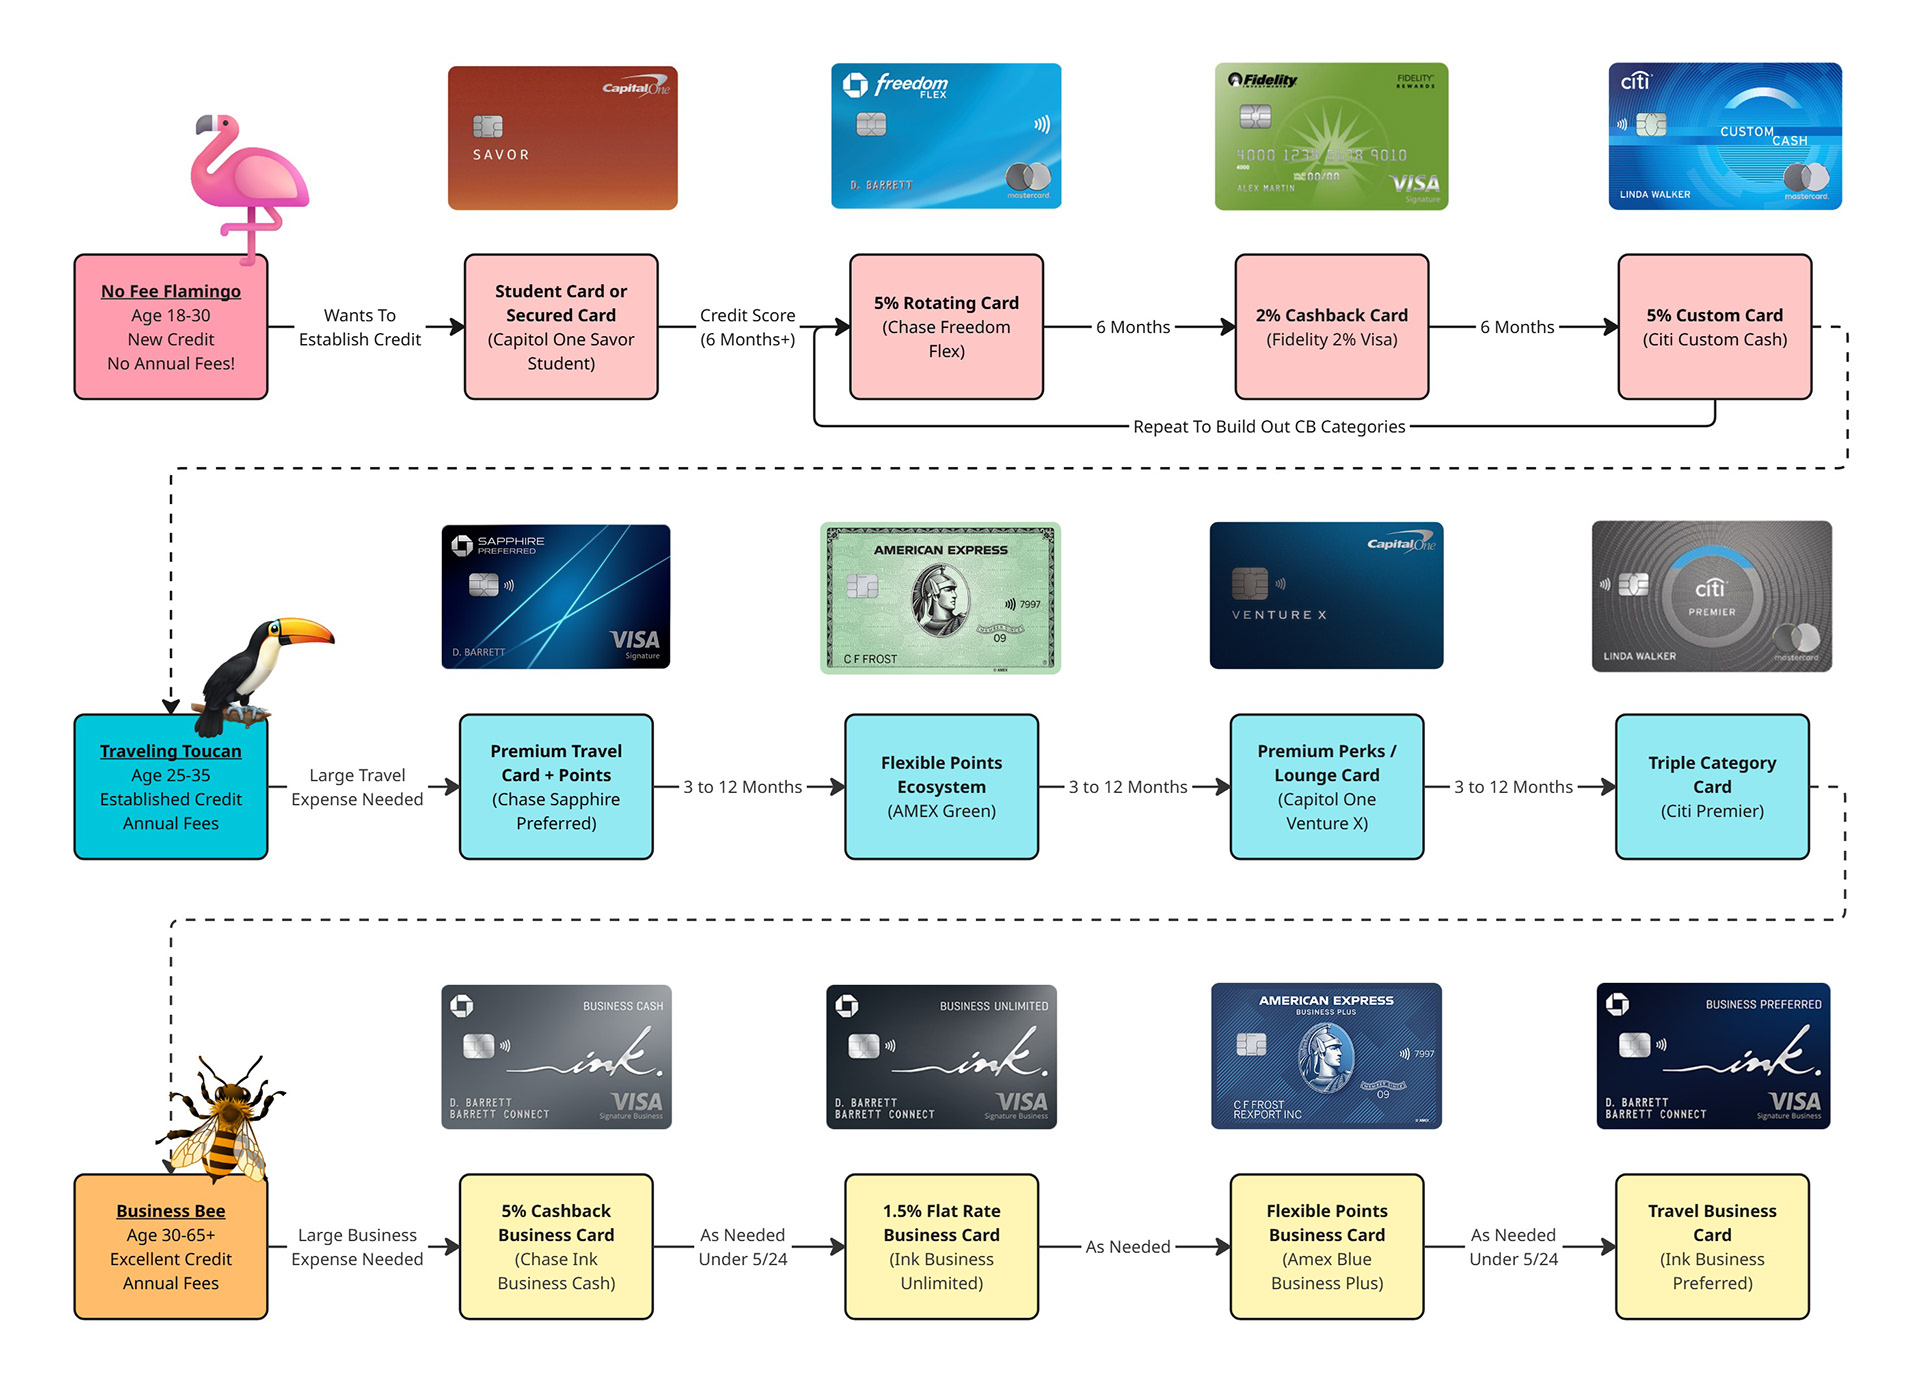
Miro Chart Insights
The Miro flow chart above illustrates the strategic card acquisition sequence for each persona, highlighting the progression from entry-level cards to more specialized products. Each sequence is carefully designed to maximize returns while managing application timing.
From the bank perspective, we can see how issuers strategically position themselves:
Chase appears in all three personas, with particularly strong presence in the Business Bee sequence, showcasing their full-spectrum approach to customer acquisition
Capital One dominates the entry-level segment with their high-ROI student card
American Express focuses on specific niches within the Traveling Toucan and Business Bee segments
The flow chart also reveals how banks create product ecosystems - Chase's Ink Business lineup and Freedom cards demonstrate how issuers develop card families that complement each other. This strategic positioning helps banks maintain customer relationships across multiple products while offering consumers opportunities to maximize value through thoughtful card selection.
Dashboard Calculations Breakdown
Cumulative Value Over Time
For each month, we calculate: Monthly Value = Sign-up Bonus - Annual Fee + Monthly Rewards
For each month, we calculate: Monthly Value = Sign-up Bonus - Annual Fee + Monthly Rewards
Sign-up bonuses only apply when a card is acquired
Annual fees apply based on the "Repeat annual fees?" parameter
Monthly rewards vary based on the "Optimized spend?" parameter
The "Continue card sequence?" parameter determines if generic cards are added after the initial sequence
Annual fees apply based on the "Repeat annual fees?" parameter
Monthly rewards vary based on the "Optimized spend?" parameter
The "Continue card sequence?" parameter determines if generic cards are added after the initial sequence
Return on Investment (ROI)
Calculated as: ROI = (Bonus + Rewards - Annual Fee) / Spend Required
Calculated as: ROI = (Bonus + Rewards - Annual Fee) / Spend Required
No Fee Flamingo's Capital One SavorOne Student card leads with 53% ROI
Chase Freedom Flex follows at 45% ROI
Chase Sapphire Preferred offers the best premium card ROI at 21%
Chase Freedom Flex follows at 45% ROI
Chase Sapphire Preferred offers the best premium card ROI at 21%
Monthly Value Rate
Calculated as: Monthly Value Rate = (Bonus + Rewards - Annual Fee) / Spend Timeframe
Calculated as: Monthly Value Rate = (Bonus + Rewards - Annual Fee) / Spend Timeframe
Chase Sapphire Preferred: $318.33/month
Chase Ink Business Preferred: $295.00/month
Chase Ink Business Cash: $270.00/month
Chase Ink Business Preferred: $295.00/month
Chase Ink Business Cash: $270.00/month
Bank Profitability Metrics
Calculated as: Break-Even Time (months) = Bonus / (Spend Required × 20% APR / 12)
Calculated as: Break-Even Time (months) = Bonus / (Spend Required × 20% APR / 12)
Capital One SavorOne Student: 30 months
Chase Sapphire Preferred: 12 months
Chase Ink Business Preferred: 6.8 months
Chase Sapphire Preferred: 12 months
Chase Ink Business Preferred: 6.8 months
Dashboard Parameters
Optimized spend?: Toggle between strategic category optimization and base rewards
Continue card sequence?: Project additional generic cards after initial sequence
Repeat annual fees?: Pay annual fees every year or cancel/downgrade after first year
Years: Adjust time horizon (1-5 years)
Continue card sequence?: Project additional generic cards after initial sequence
Repeat annual fees?: Pay annual fees every year or cancel/downgrade after first year
Years: Adjust time horizon (1-5 years)